These reports cover general functions of the system.
Shows clicks per landing page and leads per landing page, generating a conversion rate. Also includes CPA and EPC information. Find out which landing pages are hooking your leads in the most, and which are turning away potential revenue!
This report provides transparency into the Cost-Per-Acquisition of your partners, based on your partner. This transparency allows you to tailor your sources to best meet the CPA goals of your partners. Calculated as Total Sales / Total Closes for the date range
This report provides transparency into the Cost-Per-Acquisition of your sources, based on the incoming source (SRC). This transparency allows you to tailor your sources to best meet the CPA goals of your partners. Calculated as Total Sales / Total Closes for the date range.
This report shows everything you need for phone routing in the time frame. Including duration of calls, how many attempts were made, company name, conversion percentage, revenue vs attempts and more.
Shows a list of all available partners with contact and account information, as well as any comments. Keep track of your partners with this basic, but highly detailed report.
Shows partner name and company, an ID# for both, and how much that partner has paid towards their account. Hold your partners accountable with this simple report and keep track of their expenses.
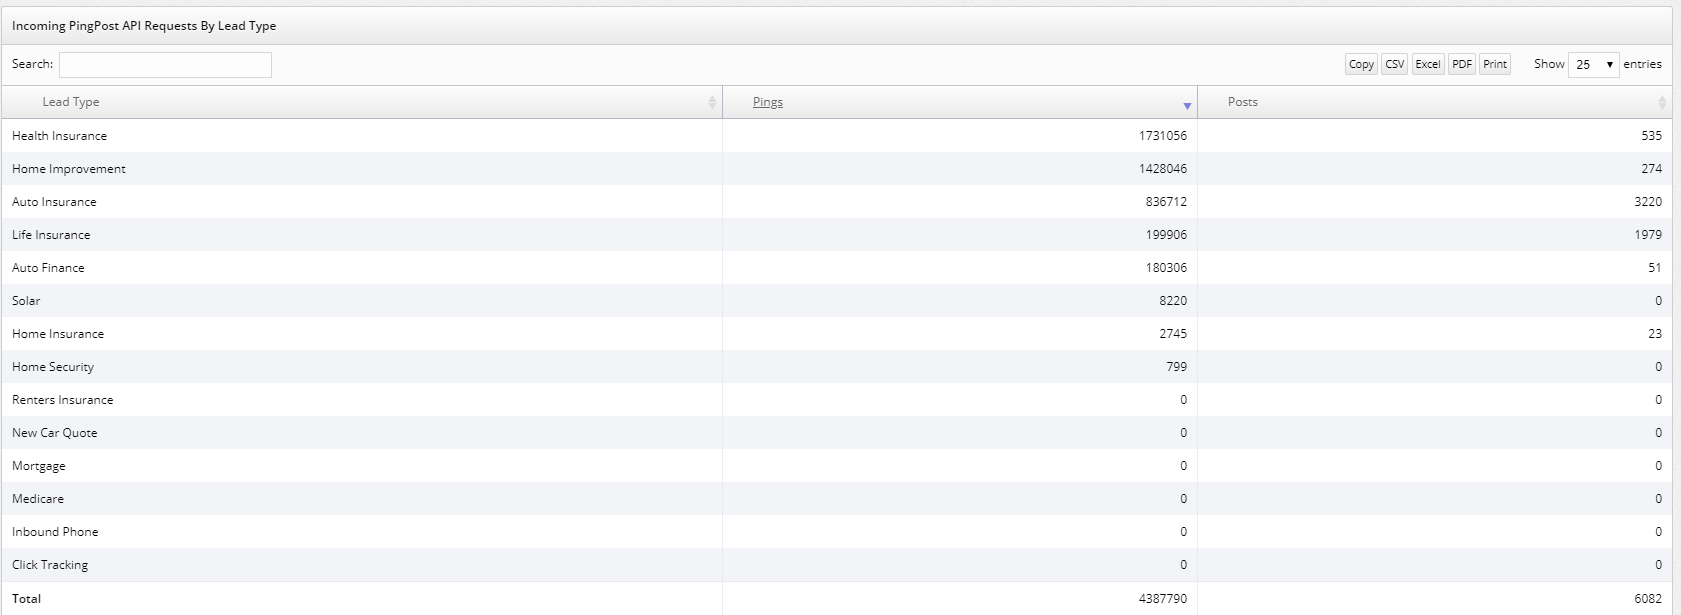
This report gives the buying rate for leads via ping post that were based on a specific filter set for a set time-frame.
Shows the partner name, specific filter set, matched pings, total posts, buying rate, post rejects and total sales by filter set.
Shows the source, total and matched pings, total posts, buying rate, post rejects and total sales by source (SRC).
Covers total profit versus costs, commissions, and unmatched leads. The most basic report you can get; keep track of your leads to make sure you’re in the green!
A more advanced profit report that goes into more depth, including money made from matched leads, sales count, and matched lead cost.
Provides information on each source’s leads, including conversion rate, decline, refund, and LeadQC information.
For each source, shows total accepted, declined, and refunded leads. Get a closer look at each source individually using this report.
Shows how many leads have been sold, split into those that have been sold exclusively and those that have been sold total. Make it easy to keep track of your volume and how it’s growing.
This report shows the total profit across all lead types and other details such as: sales, cost, commissions, total profit, total pints, net leads, matched lead and unmatched leads.
Displays how many unique sources a lead type has received information from in alphabetical order. Check out what sources are working for each individual lead type with this report. This report disregards date range.
These reports cover everything directly related to your leads.
View all the different lead statuses, such as closed, dead, working lead, etc. based on all partners combined.
Displays how many leads are gotten in each hour of the day from the start date to the finish date. Find out which times of day are ideal for your lead sales to optimize your workforce and your pricing. Only looks at start date.
Most reports within the boberdoo system are broken down by each individual lead type (Health vs. Home Improvement vs. Auto), but this report encompasses all of your lead types into one single report.
The report identifies leads rejected based on their source.
Shows what partners and filter sets generate the most matches, as well as how many matches each filter set has received. This report can help trim down any excess filter sets and keep your boberdoo system organized, as well as help your most popular filter sets stand out.
Shows numbers of unique leads, flips, refunds, and sales & refund balances for each landing page. This report can help you identify and improve struggling landing pages, as well as point out your most successful pages.
Shows number of unique leads, flips, refunds, and sales & refund balances for each source. Find your most successful or refund-heavy sources with this report as a first step to troubleshooting your sources.
Shows what sources have sold leads from which states, as well as graphs this information. Find out where your hottest leads are coming from, and what states bring up the most duds.
This report shows the statuses for leads based on what source they are involved with.
View all the different lead statuses, such as closed, dead, working lead, etc. based on a by partner basis.
Shows total leads from each available source. Find out which sources are providing the most volume for you here.
Shows how many leads are matched, unmatched, or declined within the specified date range. Quality check the path your leads are taking from a bird’s eye view with this useful tool.
Shows how many leads were bought from which vendors. This report can tell you which vendors are pulling their weight and which are not as useful.
Shows sales, sent leads, accepted leads, and rejected leads by partner in a table, as well as a bar graph. Also shows price per lead for any with sold leads. Check what partners are buying or rejecting your leads to make sure you have buyers that are helping your business.
Shows sale and refund information based on the landing page the lead was submitted through. Pinpoint what pages are leading to bogus leads or duplicates to keep your web traffic fresh and interested.
For each source, shows total leads sent, total leads sold, number of flips, leads returned, approved returned leads, and leads declined. Find out which sources are leading to the most refunds with this tool and optimize your volume of successful leads.
Shows a graph of each user and their total approve/decline rate for manually reviewed leads. For vendors and partners with a workforce, this keeps track of who approves which manually reviewed leads and ensures accountability. A lifesaver for those that manually review leads often!
Shows total, matched, unmatched, declined, and pending leads by day. Keep track of leads at all different stages throughout the week, month, or year and see when your traffic ebbs and flows.
Shows how many leads have been sold, split into those that have been sold exclusively and those that have been sold total. Makes it easy to keep track of your volume and how it’s growing.
These reports cover everything directly related to your landing pages.
Provides a graph of total clicks, leads, and declines per day/week/month/year for different landing pages. Also shows each landing page’s changing stats over a day/week/month/year as a percentage. This report can tell you which landing pages are winners and which are duds to help maximize your web generation.
Shows sale and refund information based on the landing page the lead was submitted through. Pinpoint what pages are leading to bogus leads or duplicates to keep your web traffic fresh and interested.
Shows numbers of unique leads, flips, refunds, and sales & refund balances for each landing page. This report can help you identify and improve struggling landing pages, as well as point out your most successful pages.
These reports cover everything directly related to your sources.
For each source, shows total leads sent, total leads sold, number of flips, leads returned, approved returned leads, and leads declined. Find out which sources are leading to the most refunds with this tool and optimize your volume of successful leads.
Shows the number of unique leads, flips, refunds, and sales & refund balances for each source. Find your most successful or refund-heavy sources with this report as a first step to troubleshooting your sources.
Shows sales and costs of all leads coming through specific sources, sorted by the date the lead entered the system. Also shows the total number of matched/unmatched leads, and profit.
Shows sales and costs of all leads coming through specific sources, sorted by the date the lead is sold. Also shows the total number of matched/unmatched leads, and profit.
Displays how many unique sources a lead type has received information from in alphabetical order. This report disregards date range.
These reports cover everything directly related to refunds, declines, and duplicate leads.
These reports cover everything directly related to your partners.
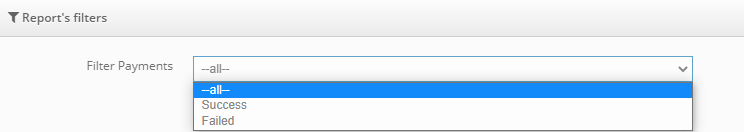
You can filter payments by success and failure for your partners and the amounts.
These reports cover everything about live transfers and phone routing
Shows the number, status, network, source, campaign, vertical and billable minutes.
This report shows the number of caller ID checks.
Shows the campaign name and the total number of calls for each hour.
Similar to the Inbound Phone Calls By Hour report, but this one can be filtered by lead status.
Shows the campaign names, verticals, phone numbers and the number of calls received.
This report shows pretty much everything you need if you use phone routing. Such as the calls matched order, company name, attempts, successes, fails, rollback attempts, how much revenue vs. attempts, conversion percentage, average call time and total duration.
Shows the lead type and the number of pings and posts.