Use Case #1: Answering ad-hoc questions with visualization
Understand the Challenge
Home Improvement Leads LLC (HIL) collects quality leads from various sources and sells them to companies offering home improvement services. Currently HIL is based in Florida, and accepts leads from Florida, Texas, and Alabama. Being the market leader in the region, on Wednesday’s board meeting HIL decided the next move to be expanding to further states in East. The decision came fast, giving only two days for the management to come up with a detailed strategic plan.
With high risk-awareness and limited resources for setting up new filters, however, there are still many questions to be answered before taking the next step.
-
What was the most profitable home improvement project in the past month?
-
What time of the day are the highest averages seen for those leads in the market?
Special request from the management: Make sure HIL starts dealing with truly quality leads in the new region without losing its reputation right at the start. The management wants to apply the analysis for leads who are homeowners above the age of 40 with excellent credit ratings.
Check out boberdoo’s 30 minute “Lunch Break Solution” powered by Amazon QuickSight.
Set up the Data Source
With time being the smallest asset in HIL’s case, let us skip the data integration part where we connect all data within the boberdoo system to AWS QuickSight. Instead, the only thing we need to do is to export one month's worth of data, save it to a CSV file and directly upload it to QuickSight.
With few clicks here and there, all our questions are answered within seconds.
Prepare the Data
Considering the special wishes for the quality leads, let us start with selecting the ones we are interested in: excellent credit rating, above 40 and a homeowner.
QuickSight provides a filter area where filters are set up and applied for one or multiple charts. We can easily select the attribute and then the value from the list of available ones, or set up ranges.

Figure 1. Filter Area within QuickSight
Once we have our data ready, we switch back to the Visualize page and prepare the charts.
Answer an Ad-hoc Question
1. Most Profitable Home Improvement Projects
First, we want to figure out which projects to target in the new states. For this, we need to know the Total Revenue, Cost and Profit by Projects.
The chart below shows that Roofing projects are way ahead of any other ones when it comes to return ($25k), about five times more than second best Painting with its $5k.
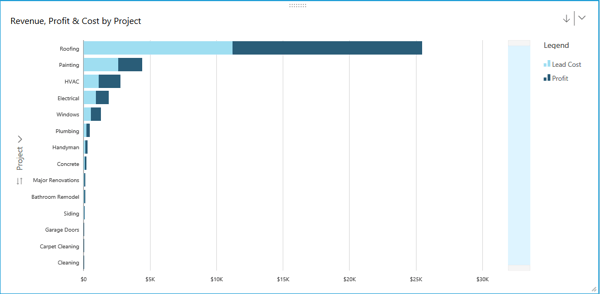
Figure 2. Revenue, Profit and Cost by Project
2. Best Performing Sources for Roofing Projects
Let’s focus on Roofing and Painting projects for now. With a simple left click on the bar, we can drill-down and see directly the sources that were sending Roofing leads to the system and compare their performance.
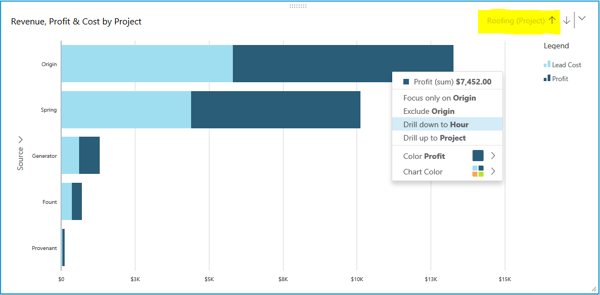
Figure 3. Drill down for Details on a Specific Project
Now let’s inspect the sources separately. The $25k monthly revenue from Roofing projects are mainly generated by 250 leads coming from the source Origin and Spring. The remaining 10% are provided by Generator, Fount, and Provenant. However, these are too small to deal with in the first phase of expansion. Let’s focus on Origin for now and consider Spring later.
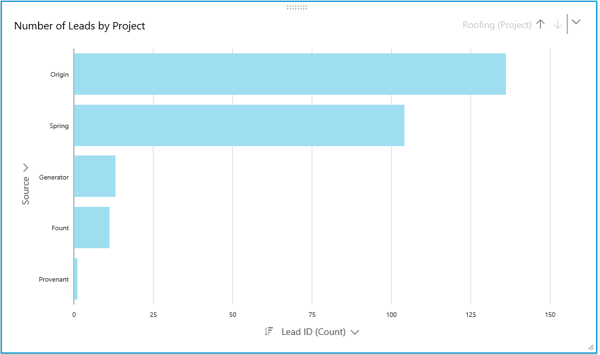
Figure 4. Number of Leads Generated by Source
Let’s change the layout of the chart and see how these leads are translated into dollar amounts.
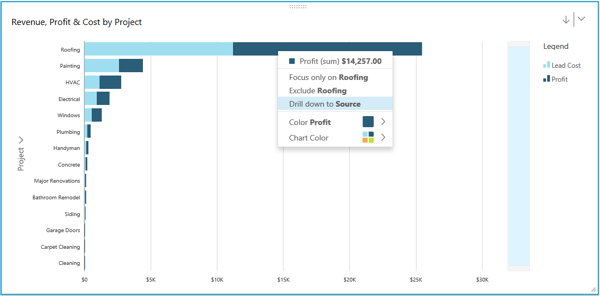
Figure 5. Revenue, Profit and Cost of Roofing Leads by Source
Now we can see that the $25k total revenue from Roofing projects is generated by leads provided by Origin ($13k) and Spring ($10k). Hence, they do not only provide the highest number of Roofing leads, but these also sell for a competitive price, creating the highest sums of revenue.
3. Averages by the Time of the Day
Let’s drill down on Origin and check the times of the day when the market is the hottest for Roofing leads.
Note: With the same left click on the bar, now we have the option to either drill back up to the level of Projects or drill further down on the Hour. The right upper corner on the chart also tells us which level we are currently on: Roofing.
Drilling down on the time of the day, we want to further explore which time periods within a day are the best to set up filters for. Looks like the most revenue is generated in the morning times, between 9am and 11am.
Note: In this period the average prices (orange line) are changing - something we have to consider when setting up the profit margins.
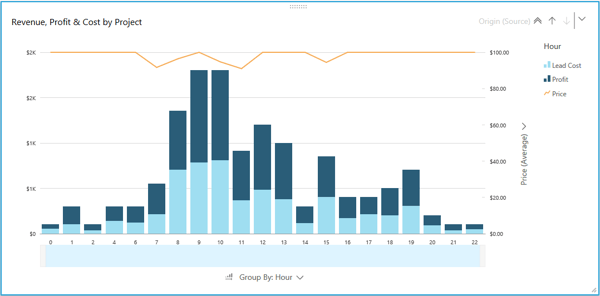
Figure 7. Revenue, Profit, Cost and Average Price by the Hour of the Day

BONUS Question
Since we have 5 minutes left out of the 30, let us create another visualization that tells us how weekdays vs weekends affect the business. We are specifically interested in the number of leads processed each day, and what was the average profit per lead.
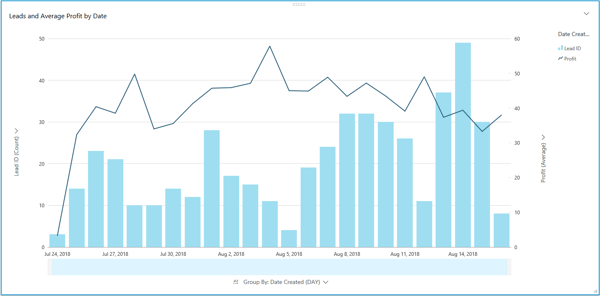
Figure 8. Number of Leads and Average Profit on Weekdays vs. Weekends
The boberdoo system is always looking for new integrations to help lead generators spend their time wisely. This 30 minute "Lunch Break Solution" can be used in many more verticals than just home improvement, which you will find out in Use Case 2 later. Implementing AWS QuickSight is one of many examples of how we strive for excellence in our flexible lead distribution system. Could boberdoo be right for you? Click the banner above to learn about more features that could assist your business in all areas of lead distribution.