Use Case #1: Answering ad-hoc questions with visualization
Understand the Challenge
Home Improvement Leads LLC (HIL)collects quality leads from various sources and sells them to companies offering home improvement services. Currently HIL is based in Florida, and accepts leads from Florida, Texas, and Alabama. Being the market leader in the region, on Wednesday’s board meetingHIL decided the next move to be expanding to further states in East.The decision came fast, giving only two days for the management to come up with a detailed strategic plan.
With high risk-awareness and limited resources for setting up new filters, however, there are still many questions to be answered before taking the next step.
- What was the most profitable home improvement project in the past month?
- Which source provides the most leads for that project and what was the total revenue, cost and profit?
- What time of the day are the highest averages seen for those leads in the market?
Special request from the management: Make sure HIL starts dealing with truly quality leads in the new region without losing its reputation right at the start. The management wants to apply the analysis for leads who are homeowners above the age of 40 with excellent credit ratings.
Check out boberdoo’s 30 minute “Lunch Break Solution”powered byAmazon QuickSight.
Set up the Data Source
With time being the smallest asset in HIL’s case, let us skip the data integration part where we connect all data within the boberdoo system to AWS QuickSight. Instead, the only thing we need to do is to export one month's worth of data, save it to a CSV file and directly upload it to QuickSight.
With few clicks here and there, all our questions are answered within seconds.
Prepare the Data
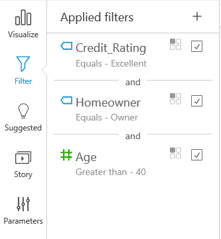
Considering the special wishes for the quality leads, let us start with selecting the ones we are interested in: excellent credit rating, above 40 and a homeowner.
QuickSight provides a filter area where filters are set up and applied for one or multiple charts. We can easily select the attribute and then the value from the list of available ones, or set up ranges.
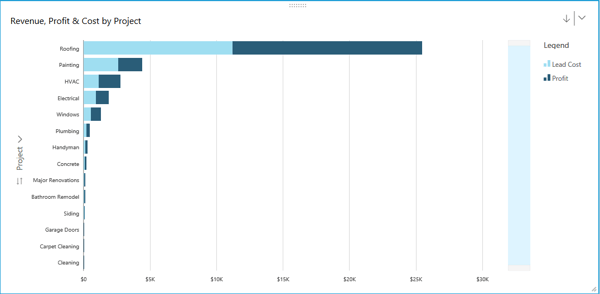
Figure 1. Filter Area within QuickSight
Once we have our data ready, we switch back to theVisualizepage and prepare the charts.
Answer an Ad-hoc Question
1. Most Profitable Home Improvement Projects
First, we want to figure out which projects to target in the new states. For this, we need to know the Total Revenue, Cost and Profit byProjects.
The chart below shows thatRoofingprojects are way ahead of any other ones when it comes to return ($25k), about five times more than second bestPaintingwith its $5k.
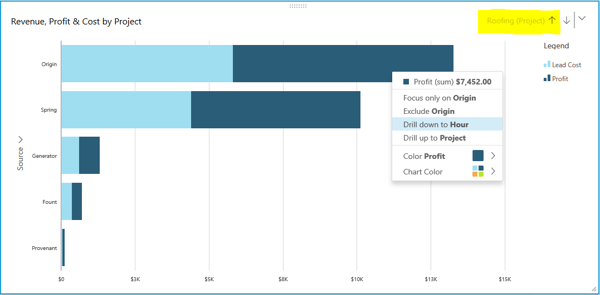
Figure 2. Revenue, Profit and Cost by Project
2. Best Performing Sources for Roofing Projects
Let’s focus onRoofingandPaintingprojects for now. With a simple left click on the bar, we can drill-down and see directly the sources that were sendingRoofingleads to the system and compare their performance.
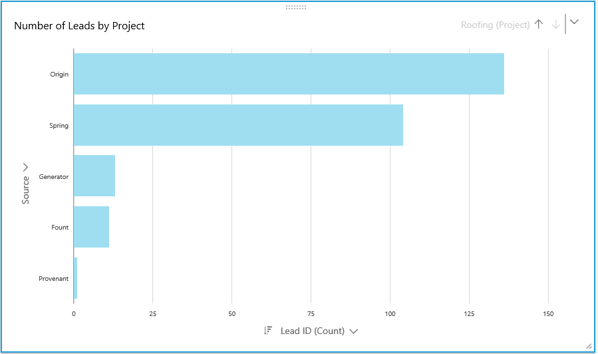
Figure 3. Drill down for Details on a Specific Project
Now let’s inspect the sources separately. The $25k monthly revenue fromRoofingprojects are mainly generated by 250 leads coming from the sourceOriginandSpring.The remaining 10% are provided byGenerator,Fount, andProvenant. However, these are too small to deal with in the first phase of expansion. Let’s focus onOriginfor now and considerSpringlater.
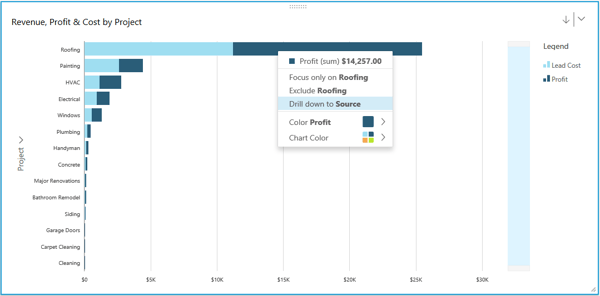
Figure 4. Number of Leads Generated by Source
Let’s change the layout of the chart and see how these leads are translated into dollar amounts.
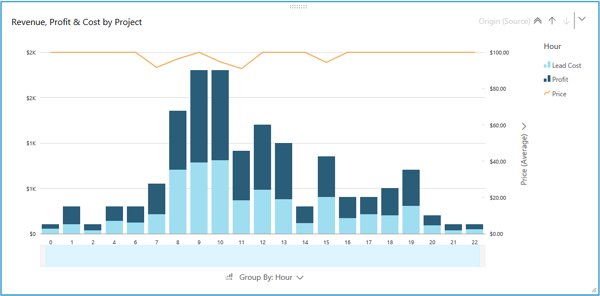
Figure 5. Revenue, Profit and Cost of Roofing Leads by Source
Now we can see that the $25k total revenue fromRoofingprojects is generated by leads provided byOrigin($13k) andSpring($10k). Hence, they do not only provide the highest number ofRoofingleads, but these also sell for a competitive price, creating the highest sums of revenue.
3. Averages by the Time of the Day
Let’s drill down onOriginand check the times of the day when the market is the hottest forRoofingleads.
Note: With the same left click on the bar, now we have the option to either drill back up to the level ofProjectsor drill further down on theHour. The right upper corner on the chart also tells us which level we are currently on:Roofing.
Drilling down on the time of the day, we want to further explore which time periods within a day are the best to set up filters for. Looks like the most revenue is generated in the morning times, between 9am and 11am.
Note: In this period the average prices (orange line) are changing - something we have to consider when setting up the profit margins.
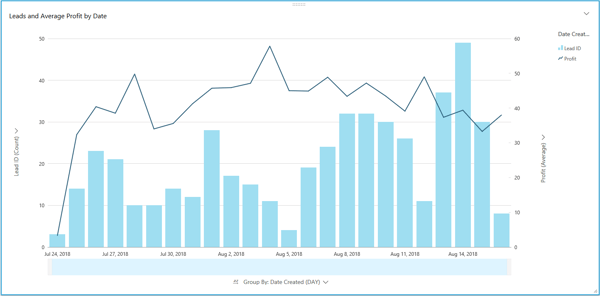
Figure 7. Revenue, Profit, Cost and Average Price by the Hour of the Day
4. Weekdays vs Weekends
Let us create another visualization that tells us how weekdays vs weekends affect the business. We are specifically interested in the number of leads processed each day, and what was the average profit per lead.
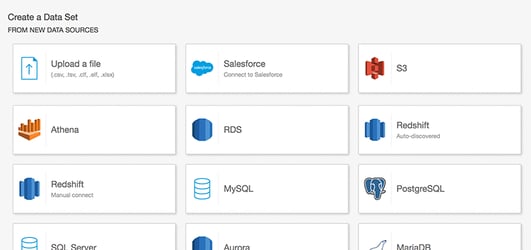
Figure 8. Number of Leads and Average Profit on Weekdays vs. Weekends
Use Case #2: Drilling-down into massive data
Understand the Challenge
Your Best Leads LLC (YBL) is dealing with 2 million leads on a daily basis, as well as managing efficient email campaigns involving 8 different verticals, 10 ISPs, 20 ESPs, and hundreds of creatives. That is quite a bit of work for the marketing team, especially without the necessary information at hand.
YBL’s main pains point are:
- Running SQLqueries takes too much time- sometimes hours
- Excel crashesunder large datasets
- Current reporting requirestoo much maintenance
- Reports themselves don't allow for users todrill down on outlier data pointsand overall it's not veryinteractive/intuitivewhen trying to optimize or analyze campaigns
Suggested High Level Solution
Companies are often forced to write long and complex ad-hoc SQL queries or manually send spreadsheets to each other to share data and insights. This is not only time consuming, but also highly inefficient, as static tables need to be sent back and forth whenever updated and often employees get lost within the numbers. Reports become unreliable, while decisions are harder and riskier to take.
With QuickSight’s serverless architecture, you can share automatically updated, detailed and interactive dashboards with all your users, allowing them to drill-down and explore the data to answer ad-hoc questions and gain relevant insights.
1. Connect YBL’s database to QuickSight
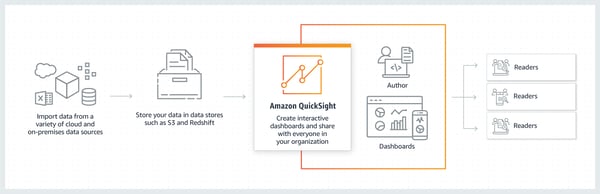
Figure 1. AWS Data Sources
QuickSight allows you to directly connect to and import data from a wide variety of cloud and on-premises data sources. These include SaaS applications such as Salesforce, Square, ServiceNow, Twitter, Github, and JIRA; 3rd party databases such as Teradata, MySQL, Postgres, and SQL Server; native AWS services such as Redshift, Athena, S3, RDS, and Aurora; and private VPC subnets. You can also upload a variety of file types, including Excel, CSV, JSON, and Presto.
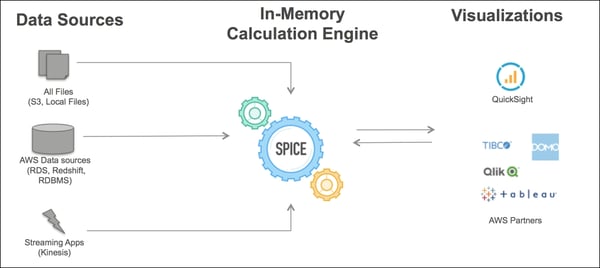
Figure 2. High Level Architecture of an AWS QuickSight Environment
2. SPICE it up
With SPICE (super-fast, parallel, in-memory, calculation engine), QuickSight’s in-memory calculation engine, you can achieve the best performance at scale currently available on the market. SPICE automatically understands your data and replicates it in a way that allows thousands of users to simultaneously create fast, interactive analysis while saving you time and resources.
Figure 3. SPICE Architecture
3. Create Dashboards
Once you choose the desired data sources and connected them to QuickSight, you can go ahead and build your own dashboards. We suggest starting with the most often used reports and charts, and then add the drill down feature to it.
The boberdoo system is always looking for new integrations to help lead generators spend their time wisely. Implementing AWS QuickSight is one of many examples of how we strive for excellence in our flexible lead distribution system. Could boberdoo be right for you?