AI Supported Bid Experiments And How They Are Implemented
A few years back we promised an easy, simple and quick way to evaluate bids and profit margins for different lead segments. We accomplished all of this by setting up Bid Experiments. Little did we know, even though setting up the initial experiment only takes a few minutes, the process of figuring out the right hypotheses to test requires both deep analysis and some dirty digging of the time frame's data, which can all be rather time-consuming.
On the other hand, doing this regularly requires a full-time data analyst who has several years of professional experience and industry knowledge, as well. In turn, both of those can be rather budget consuming.
In the past, we have tried to help our clients with this process by offering regular consulting sessions and exclusive data analysis. Unfortunately, we realized it’s not only inefficient in this form, but the service - due to pricing - is only available for our top partners. This is why the rest of our clients have given up on Bid Experiments after running out of their initial testing ideas.
To combat these hangups, we have recently developed an AI feature that is not only time-efficient (which only requires a few minutes each day), but is also kind to your budget. Using this AI feature can significantly increase your monthly profits by recognizing the sweet spot segments of your incoming matched pings. Doing so will allow you to intelligently adjust your profit margins on these segments, which will result in higher overall profits!
Solution Features
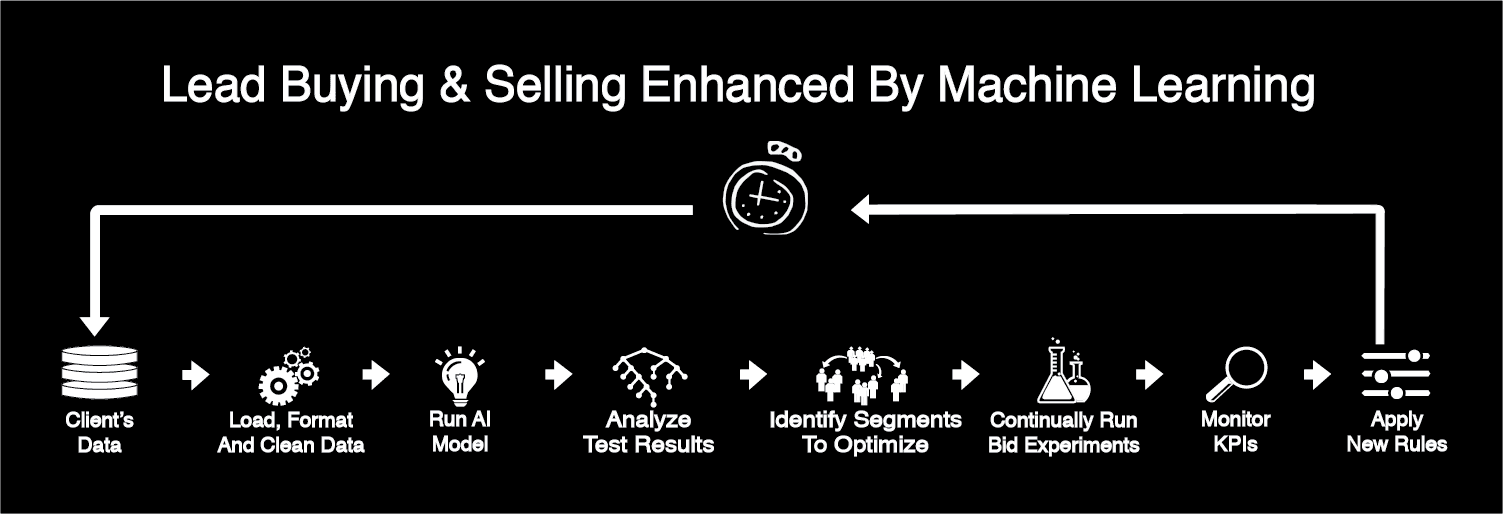
Excited? These are the steps for the implementation
First, we look at your data from the past 2 months, more specifically we’ll load, extract and transform general lead attributes (state, zip, date and time), industry specific ones (e.g. qualifying life event for health insurance, project type for home improvement, or marital status for auto insurance) - anything available with up to 20% missing data.
Once the data is in a clean format, we apply our decision-tree-based machine learning model that creates buckets of leads (segments) that show similarities in buying rate. Each leaf on the tree represents a lead segment.
As a next step the algorithm selects the segments where:
- The buying rate is too high compared to the source level average, meaning that the client is potentially losing profit due to overbidding.
- The buying rate is too low compared to the source level average, meaning that the client is potentially using high margins and hence not winning any bids.
After a quick consultation with the client, we’ll set up the selected experiments and keep monitoring their status to make sure we intervene in time if something goes off. Finally, if the experiment showed improvement, we’ll apply the settings as a rule.
Example - Health Insurance Lead Type
Note: this example is not based on real data.
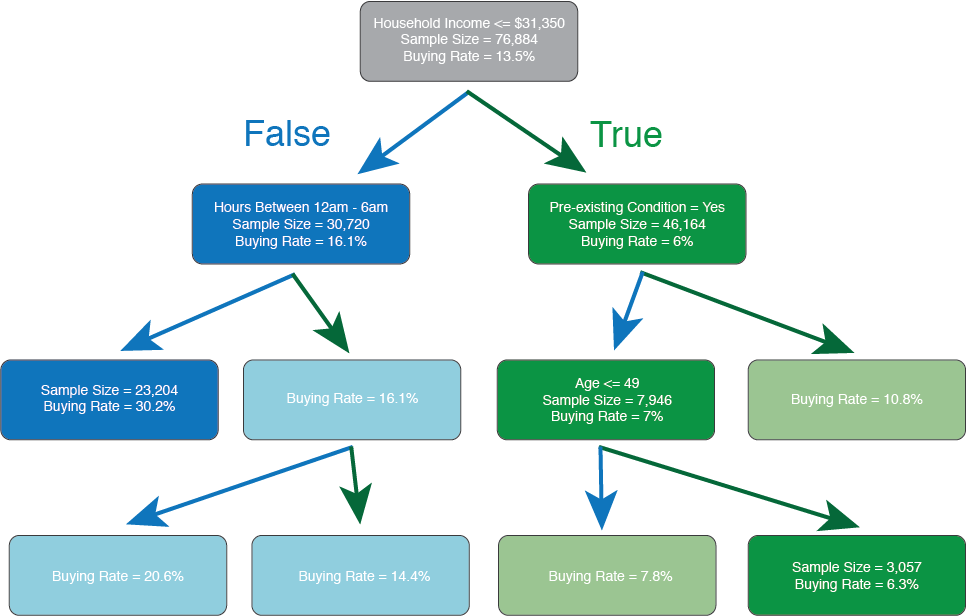
Let’s take an example from the health insurance industry. After cleaning and crunching the data, the algorithm decided that household income, hour of the day, pre-existing condition and age are the most important attributes that influence the buying rate.
The source level average buying rate is 13.5%. If we examine the leaves of the tree below, we see that it produced six different segments that show similarities in buying rate.
- The lowest buying rate (6.3%) is seen at the segment where leads have a household income less than $31,350, have no preexisting condition and are younger than 49 years old. This value is less than half of the source’s average buying rate, meaning that the applied profit margin for this specific segment is probably too high and the offered bids are not competitive enough. This in turn, results in lost opportunities.
- On the other hand, the highest buying rate (30.2%) is seen at the segment where the household income is above $31,350 and contains leads generated after 6am. This value is more than doubled compared to the source level average. Our client might be overbidding in these cases, hence increasing the profit margin for these leads could result in higher overall profits.
In both cases setting up an bid experiment that tests these hypotheses would be the next step.
Are you excited to try it out yourself? Submit a ticket and apply for beta testing today!Do you have any question? Get in touch!
We are looking for existing boberdoo clients who would like to be included in trying this exclusive new feature.
Please apply only if you:
- Have at least 5 sources with at least 10,000 incoming matched pings/source/month.
- Would like to build AB tests based on our recommendations or on your own.
- Can commit to weekly calls to review the progress.
We are excited to hear from you!